
The UK is (mostly) lagging behind Europe on nature
Some important context on *that* map.
Before it joined the EU’s predecessor in the 1970s, the UK was known as the “dirty man of Europe”.
This nickname arose in response to the nation’s filthy beaches, acid rain and belching power stations. European standards have forced a clean-up in the intervening decades, but, on nature, the UK is still lagging behind.
The dismal state of the UK’s habitats became apparent with the publication of an European Environment Agency report on Monday, assessing how Europe’s natural world has fared between 2013 and 2018.
Thanks to Brexit, this is the last time that the UK will be included in such a report, so I wanted to take this opportunity to explore the data.
The state of the UK’s habitats is glaringly bad.
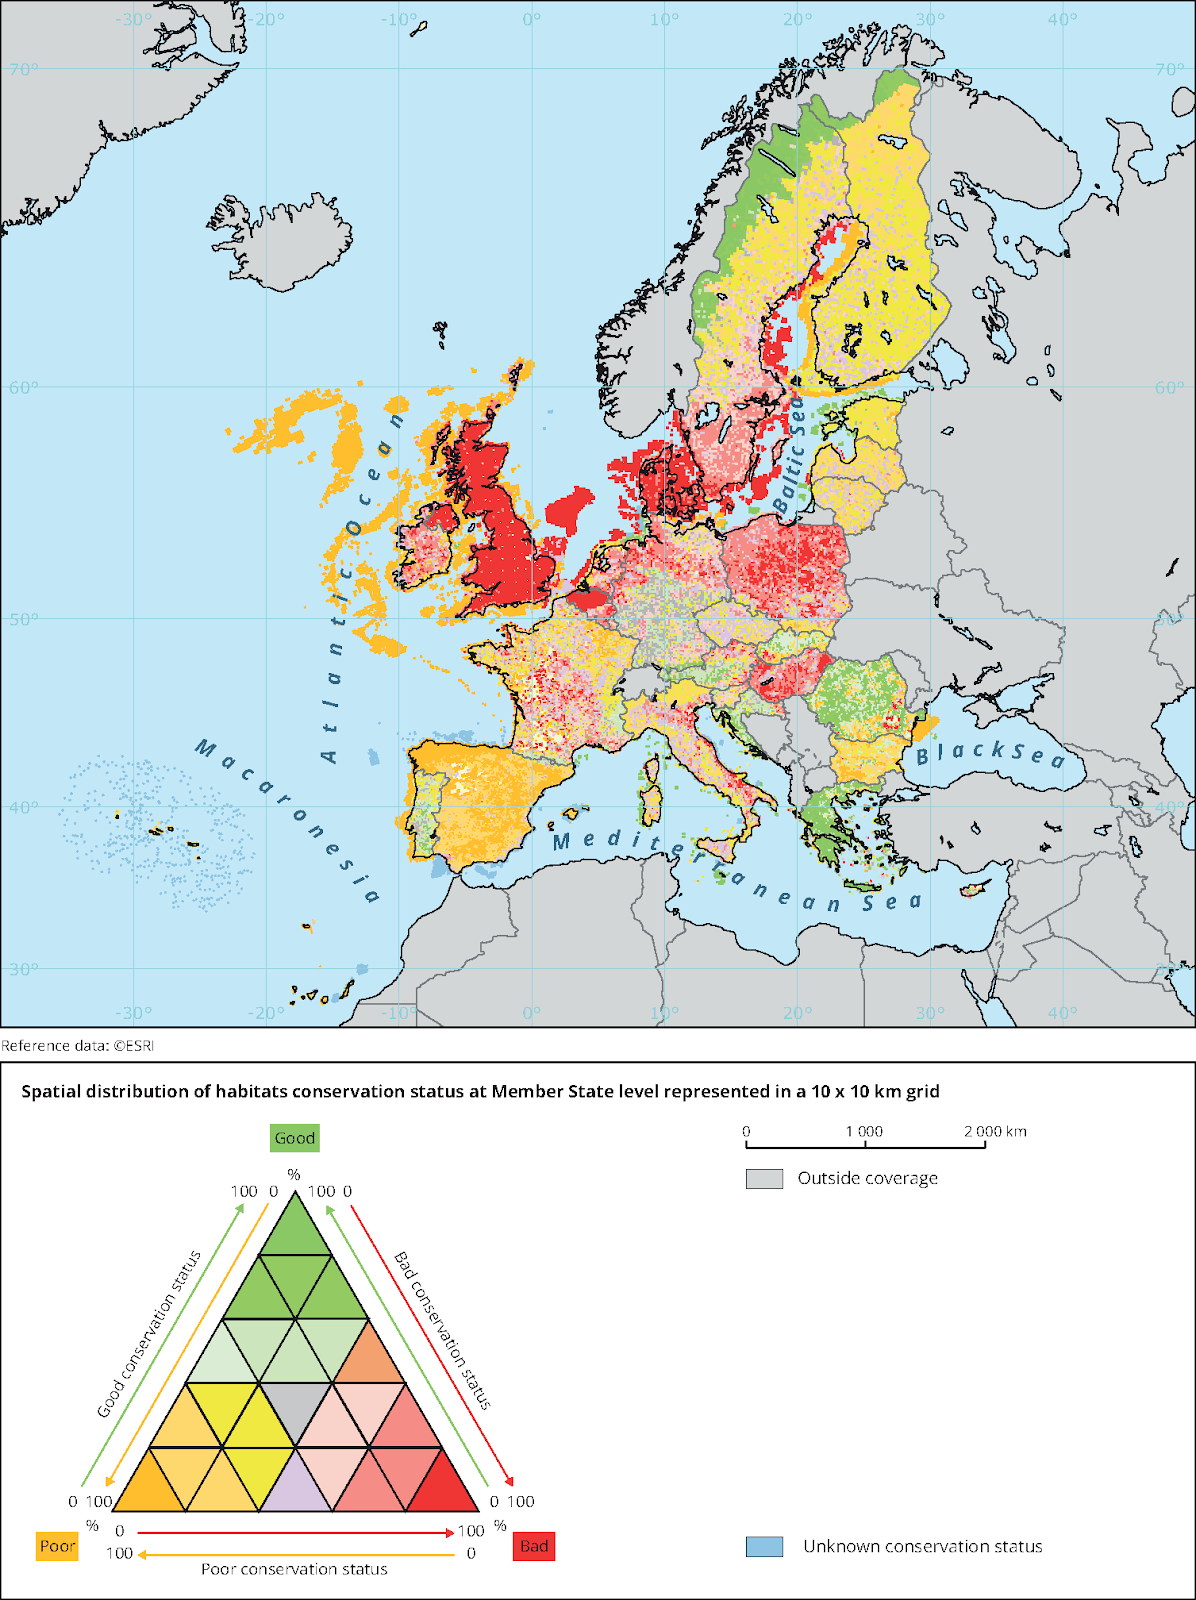
The map below shows the status of Europe’s habitats. The UK’s failure to protect its landscape is unignorable. The entire nation is painted solid red; the natural world is everywhere degraded.
(The triangular keys on the maps are really confusing. I feel like the authors need a lesson in data visualisation, but that’s another story. See the final section of this story for some thoughts on the data itself.)
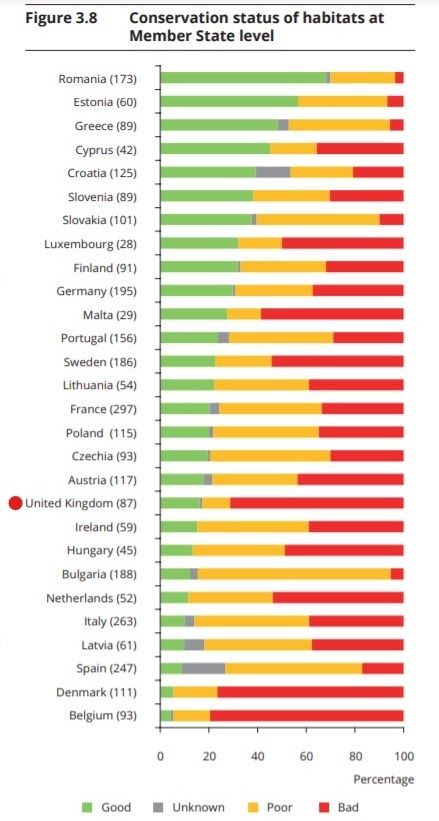
The graph below makes the UK’s position in this league table of destruction clearer (I’ve highlighted the UK with a red dot). There’s little consolation in the fact that Denmark and Belgium appear to have failed even more dramatically than the UK in safeguarding their natural environment; the three nations have the highest percentage of habitats in a bad condition.
Okay, but are the UK’s habitats improving?
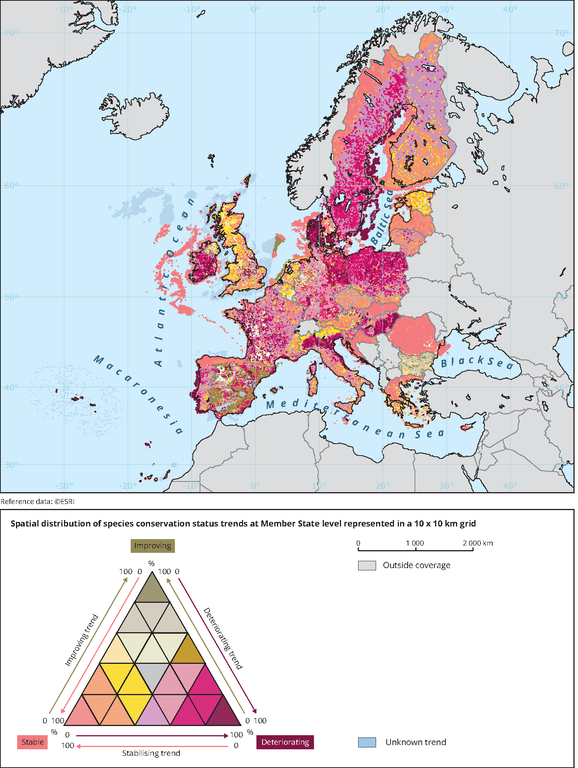
The EU report looks at whether habitats are improving, deteriorating, or in a stable condition. The following data concerns habitats in poor or bad condition (of the habitats in good condition, 87 percent are stable and 12 percent are improving).
By this metric, the UK isn’t performing quite so awfully in comparison to its neighbours, as the map shows.
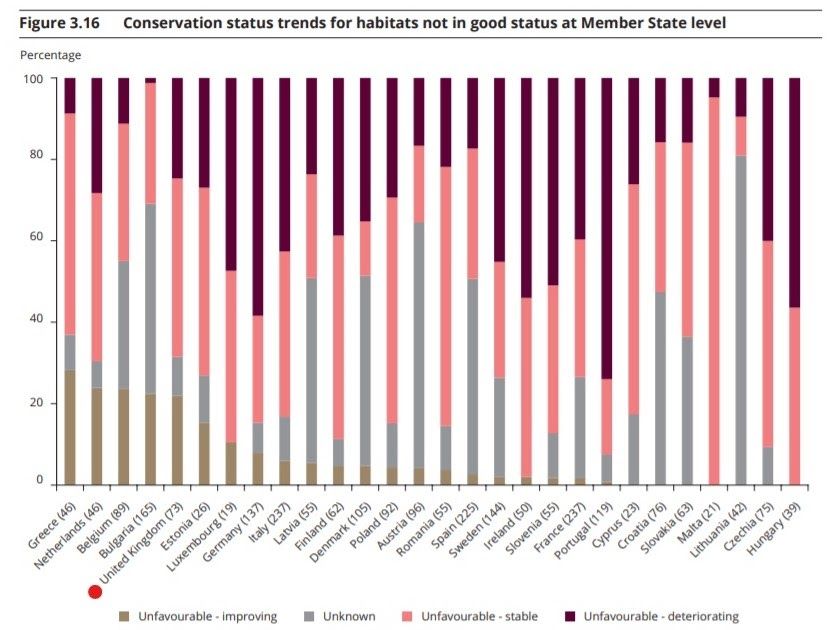
Again, the breakdown by member state makes it more apparent where the UK stands in relation to its European neighbours. Around 20 percent of the country’s degraded habitats are improving, which puts it among the top five states – although it’s important to remember that the UK’s landscapes were generally in a worse condition to begin with.
Putting that small victory aside, it’s impossible to ignore the fact that most UK habitats are either stable or deteriorating. In other words, the landscape is degraded, mostly it is not getting better, and in some cases it is getting worse.
So the UK’s habitats are in a bad way. What about species?
The EU report also shows the conservation status of species across member states, alongside an assessment of whether conditions are improving or deteriorating. The picture here isn’t quite so grim; but before we go into that, it’s worth considering this map showing the diversity of species across the continent.
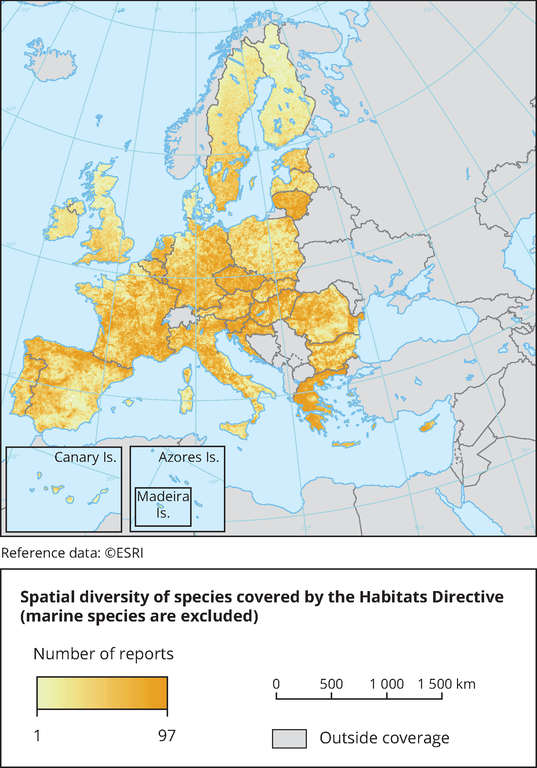
This map shows that the diversity of plants and animals in the UK, and particularly in Scotland, is generally low compared to other European countries. Of course, diversity isn’t uniform, and some places are naturally richer in species – and the report doesn’t comment on the extent to which the UK’s diversity has decreased over the years. Still, it’s worth viewing the next graphs with this information in mind.
UK species are doing well. At least, they are not generally going extinct.
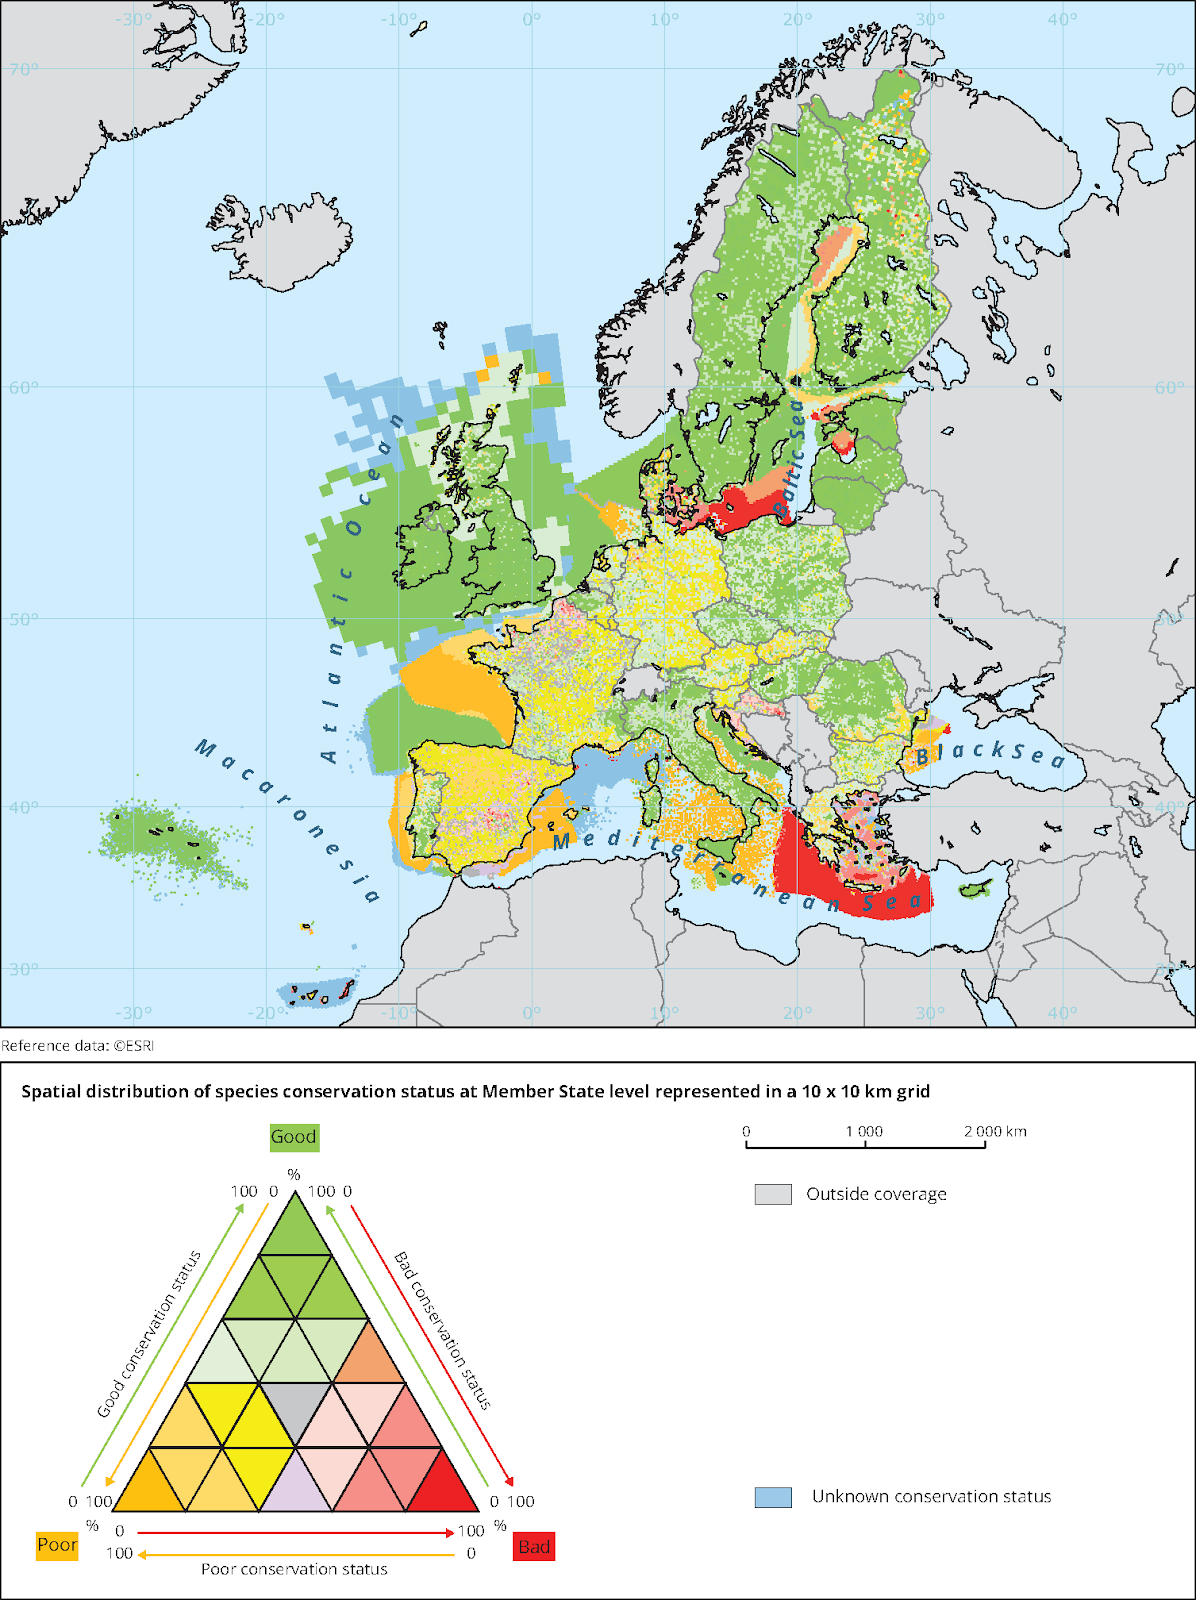
The following map shows how species as a whole are faring across Europe. It’s a more positive picture than the habitat maps, with the UK splashed green. Before getting too cheerful, though, it’s worth interrogating what it means for a species to have a good status.
The EU defines a species as being in a favourable condition if it can maintain itself within its natural habitat, its range is not currently being reduced and is unlikely to be reduced in the foreseeable future, and there is enough habitat to maintain its population on a long-term basis. In other words, it’s generally forward-looking, and doesn’t reflect large historic declines.
The report also says that, across Europe, widely distributed species are more likely to be in good condition. It’s possible that the UK’s success can be attributed to an abundance of common species that are doing well, while more sensitive species have already vanished, although the report does not explicitly comment on this.
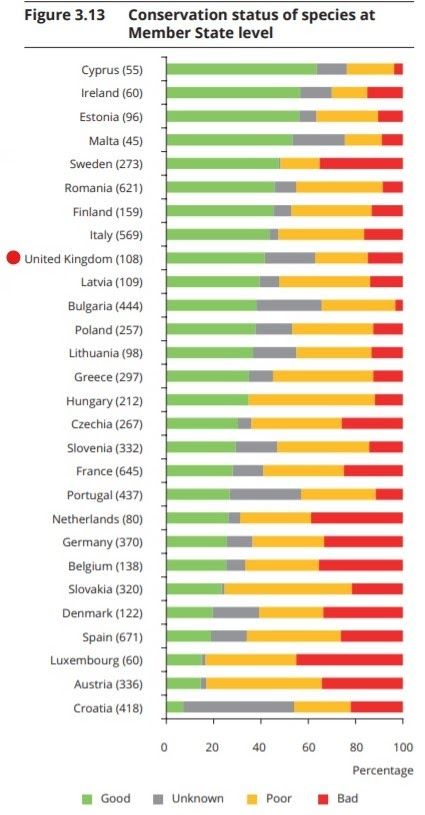
This chart, broken down by member state, shows where the UK stands in comparison to its neighbours.
How is the UK remedying the situation?
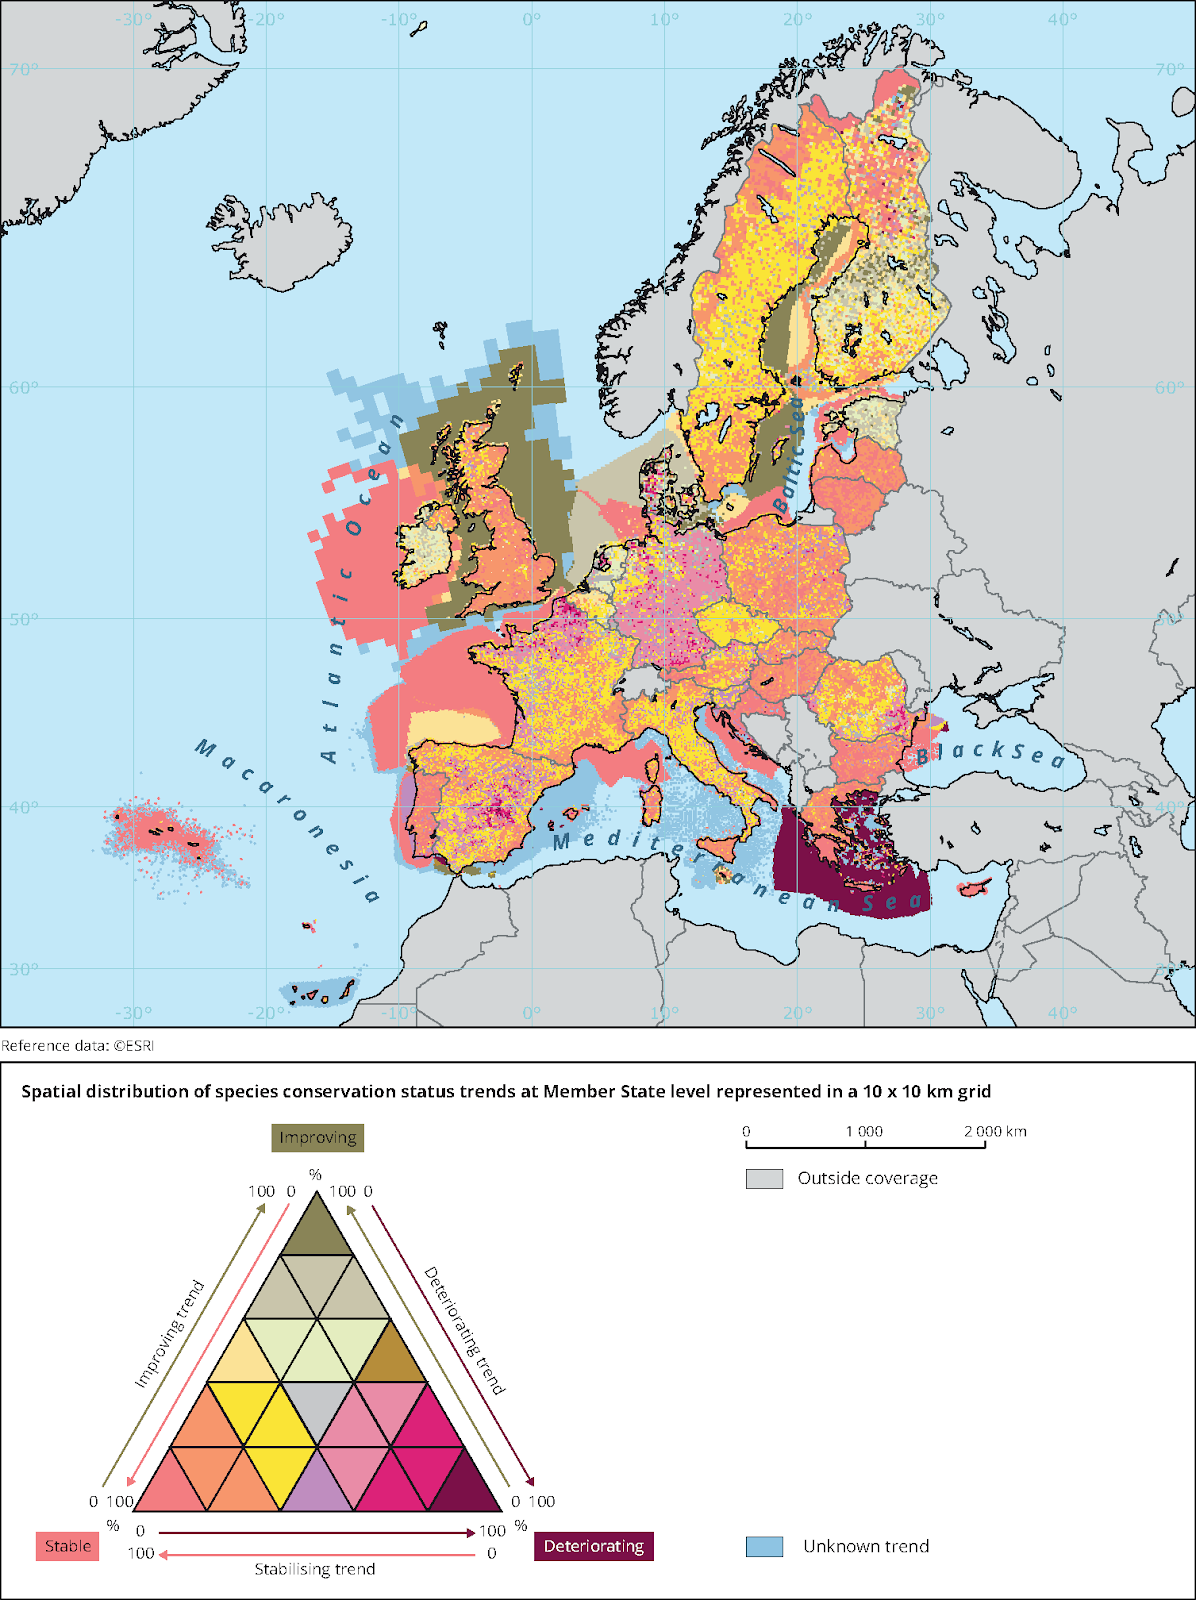
As with habitats, the report looks at the trends for species over time across the continent. This map shows that species in the UK are generally in a stable condition – and that marine species are improving.
A warning about the data
I found this report interesting because it shows, for the last time, how the UK’s habitats and species are faring in comparison to the rest of the EU. It has clearly been a massive undertaking, and broadly reflects trends in nature across the continent.
That said, I want to sound a warning about this dataset and how it’s gathered – primarily because the data is self-reported, with the key parameters set by individual states. In addition, some nations have better records than others, and so will be able to paint a more complete picture of their natural world.
In particular, it’s worth noting that countries can choose their own baselines, known as “favourable reference values”, and this choice can influence whether a species or habitat is considered to be in a favourable condition.
Many countries, including the UK, chose 1994 as the baseline year against which they measure the state of nature, which is when the relevant EU directive came into force – but, obviously, Europe’s landscape was already much degraded by that point.
In other words, I’m taking it all with a pinch of salt.
Image credit: Romacdesigns
Subscribe to our newsletter
Members receive our premium weekly digest of nature news from across Britain.
Comments
Sign in or become a Inkcap Journal member to join the conversation.
Just enter your email below to get a log in link.


